
Canada's Average Home Sold March 2013 vs 2016
Average Sales Prices are constantly evolving while the Trading Cycle is underway. Whether it's a local real estate market or the National Market as reflected in the graphics below. As the Sales Mix naturally changes while a Trading Cycle runs its course the mix of homes being included in the average price also changes causing what is actually being measured to change at the same time. It should be clear from these two graphics that the average home being sold in Canada in March of 2013 in no way resembled the average home sold in March of 2016.
If the Provincial Sales Mix simply reverted to March 2013's composition an 18% drop in national average sale price would occur immediately.
If the Municipal Sales Mix in BC reverted back to March 2013's composition a further drop of 8% would occur giving a 26% correction in prices.
If the Local Sales Mix in Vancouver, Toronto and Calgary reverted back to March 2013's composition another 4% drop would occur
leaving a 32% house price correction being recorded even before prices for homes began to fall.
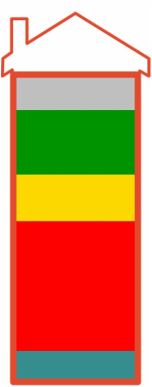 Average Canadian Home Sold 2013 Average Canadian Home Sold 2013
Average Selling Price
Composition 2013 Rest of Canada 10.2% BC 20.5% AB 14.5% ON 40.5% QC 14.4% ASP $387,532 |
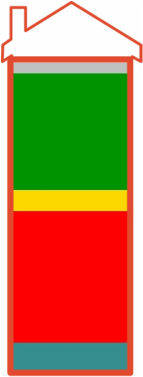 Average Canadian Home Sold 2016 Average Canadian Home Sold 2016
Average Selling Price
Composition 2016 Rest of Canada 3.7% BC 37.7% AB 6.8% ON 42.5% QC 9.3% ASP $508,567 |